
Installing Prometheus on Raspberry OS.

In a previous post we’ve installed Prometheus on Ubuntu, and this time we are installing Prometheus on a Raspberry Pi as part of our homelab monitoring server.
The Raspberry Pi we’ve chosen is this one.Model 3B -1GB.
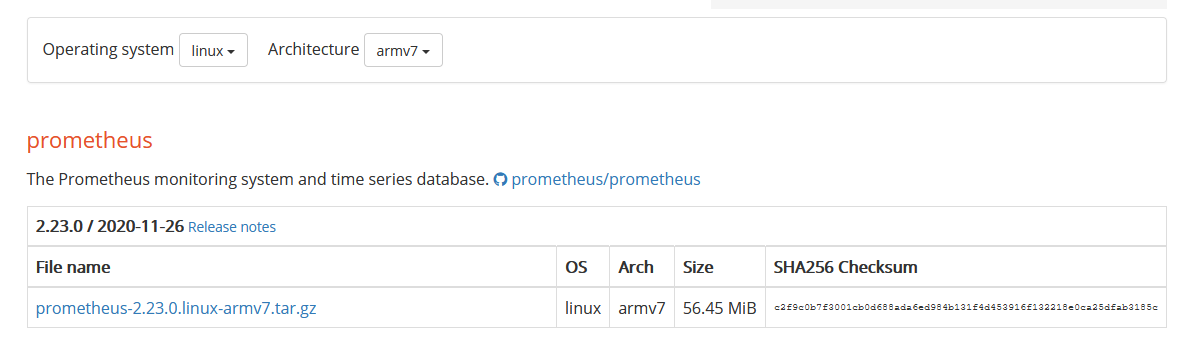
So, let’s start with downloading the software first from this link.
And from the options, we select linux and armv7
But, how do we know that armv7 is the correct version for our Pi?
For that, we can use the following command.
raspi3b1gb@raspberrypi: /home/raspi3b1gb>
$ cat /proc/cpuinfo
processor       : 0
model name      : ARMv7 Processor rev 4 (v7l)
BogoMIPS        : 38.40
Features        : half thumb fastmult vfp edsp neon vfpv3 tls vfpv4 idiva idivt vfpd32 lpae evtstrm crc32
CPU implementer : 0x41
CPU architecture: 7
CPU variant     : 0x0
CPU part        : 0xd03
CPU revision    : 4
Now that we know, which software version we can install, let's download it.
So, we right click on the “prometheus-2.23.0.linux-armv7.tar.gz” link and we execute the following, using wget.
raspi3b1gb@raspberrypi: /home/raspi3b1gb>
$ wget https://github.com/prometheus/prometheus/releases/download/v2.23.0/prometheus-2.23.0.linux-armv7.tar.gz
Then we can extract the installation files from the Gzip and rename the folder.
raspi3b1gb@raspberrypi: /home/raspi3b1gb>
$ tar xfz prometheus-2.23.0.linux-armv7.tar.gz

raspi3b1gb@raspberrypi: /home/raspi3b1gb>
$ mv prometheus-2.23.0 prometheus
And we can create a service so Prometheus can run on the background and start automatically after a reboot. (replace User= with your user id).
raspi3b1gb@raspberrypi: /home/raspi3b1gb>
$ sudo vi /etc/systemd/system/prometheus.service

[Unit]
Description=Prometheus Server
Documentation=https://prometheus.io/docs/introduction/overview/
After=network-online.target

[Service]
User=raspi3b1gb
Restart=on-failure

#Change this line if Prometheus is somewhere different
ExecStart=/home/raspi3b1gb/prometheus/prometheus \
  --config.file=/home/raspi3b1gb/prometheus/prometheus.yml \
  --storage.tsdb.path=/home/raspi3b1gb/prometheus/data

[Install]
WantedBy=multi-user.target
and we save the file.
Then we reload the
# We've created a new service so the deamon has to be update it/reload it.
raspi3b1gb@raspberrypi: /home/raspi3b1gb>
$ sudo systemctl daemon-reload

# We start Prometheus.
raspi3b1gb@raspberrypi: /home/raspi3b1gb>
$ sudo systemctl start prometheus

# Check the status of the service
raspi3b1gb@raspberrypi: /home/raspi3b1gb>
$ sudo systemctl status prometheus
? prometheus.service - Prometheus Server
     Loaded: loaded (/etc/systemd/system/prometheus.service; disabled; vendor preset: enabled)
     Active: active (running) since Fri 2020-11-13 12:50:16 UTC; 4s ago

# We enable it so it starts after a reboot.
$ sudo systemctl enable prometheus
Created symlink /etc/systemd/system/multi-user.target.wants/prometheus.service ? /etc/systemd/system/prometheus.service.
raspi3b1gb@raspberrypi: /home/raspi3b1gb>
Now we can go to our browser and search for the http://ipOfThePI:9090/metrics.

and don’t forget to add port 9090 to your firewall list :-D.
$ sudo ufw status |grep 9090
9090 			ALLOW       Anywhere
9090 (v6)       ALLOW       Anywhere (v6)
Next time we are installing Grafana to complete the monitoring solution on our homelab server.